399.00
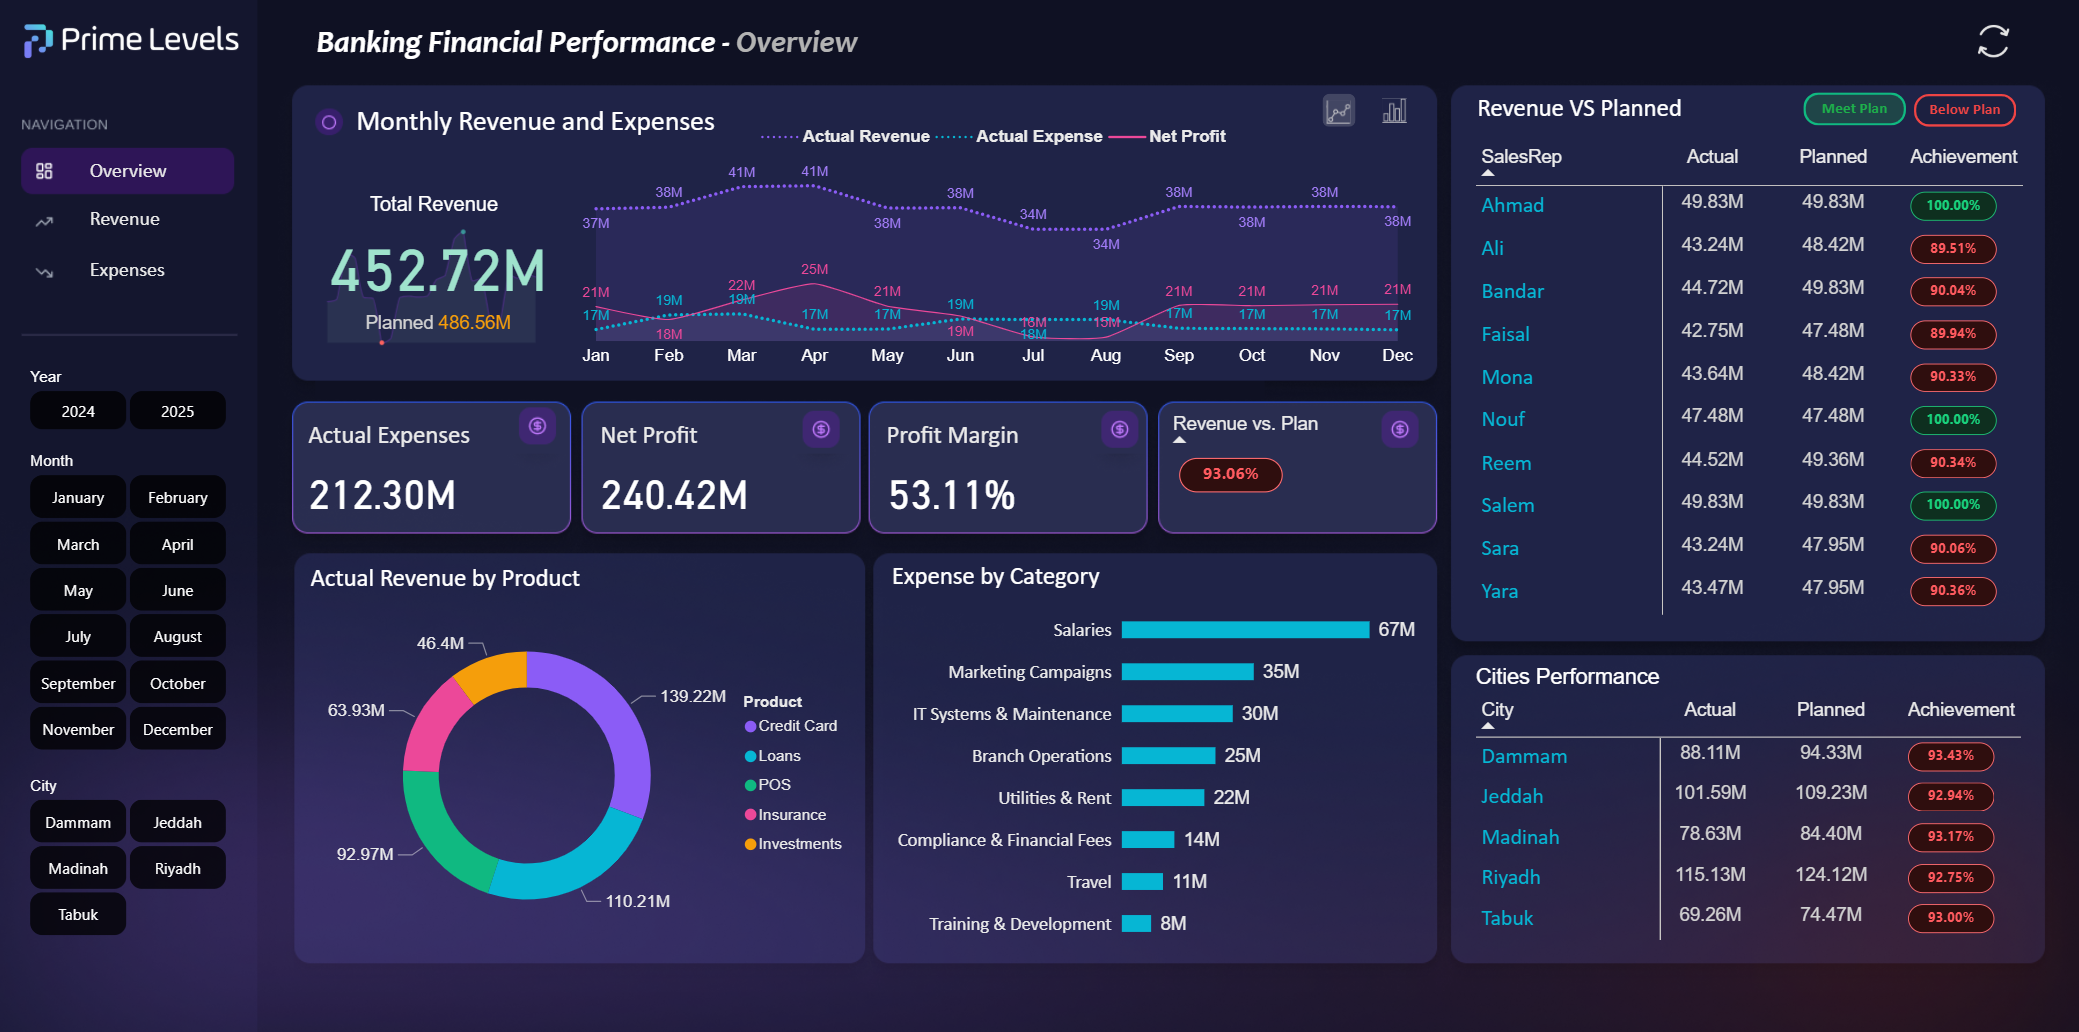
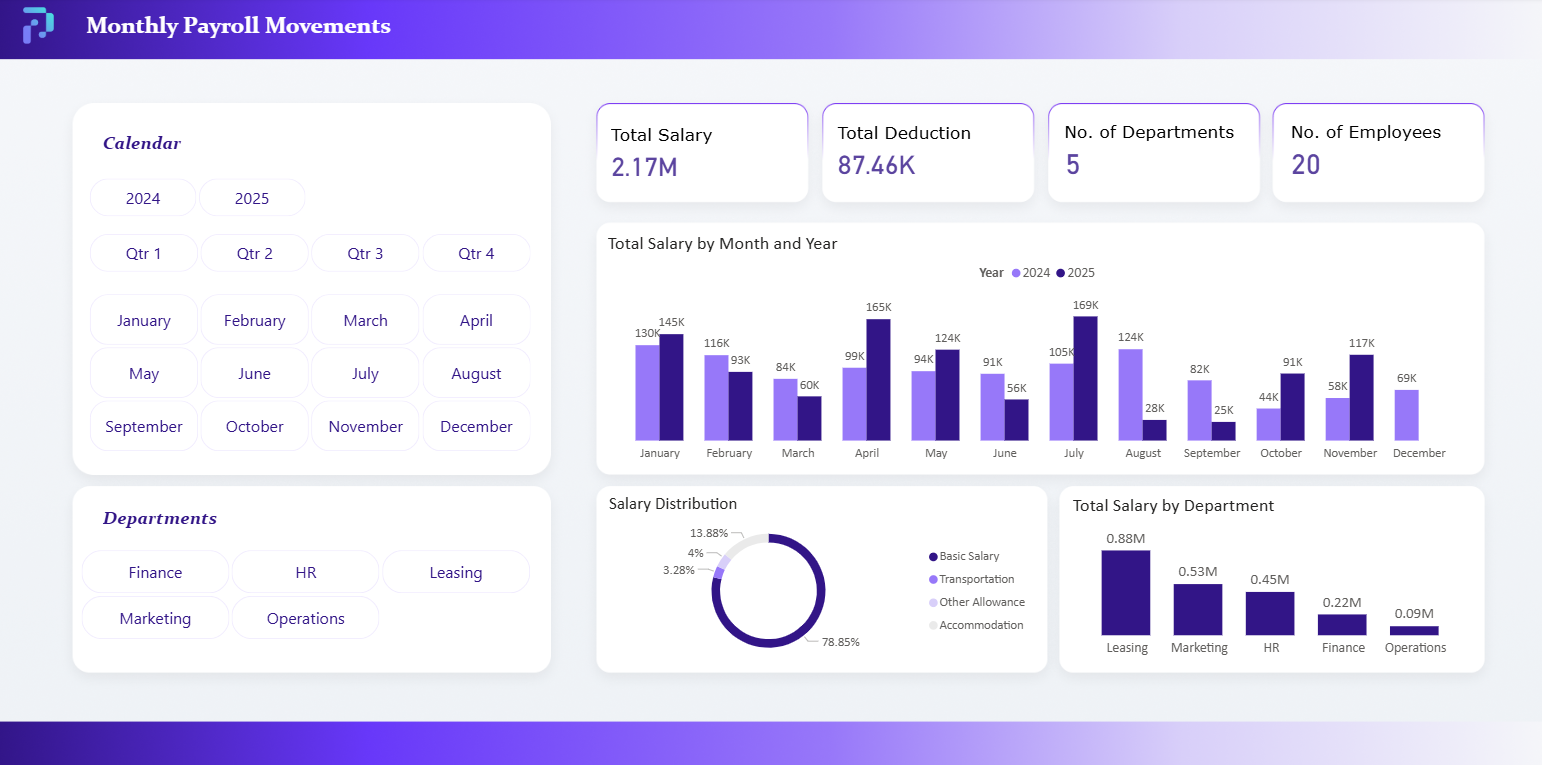
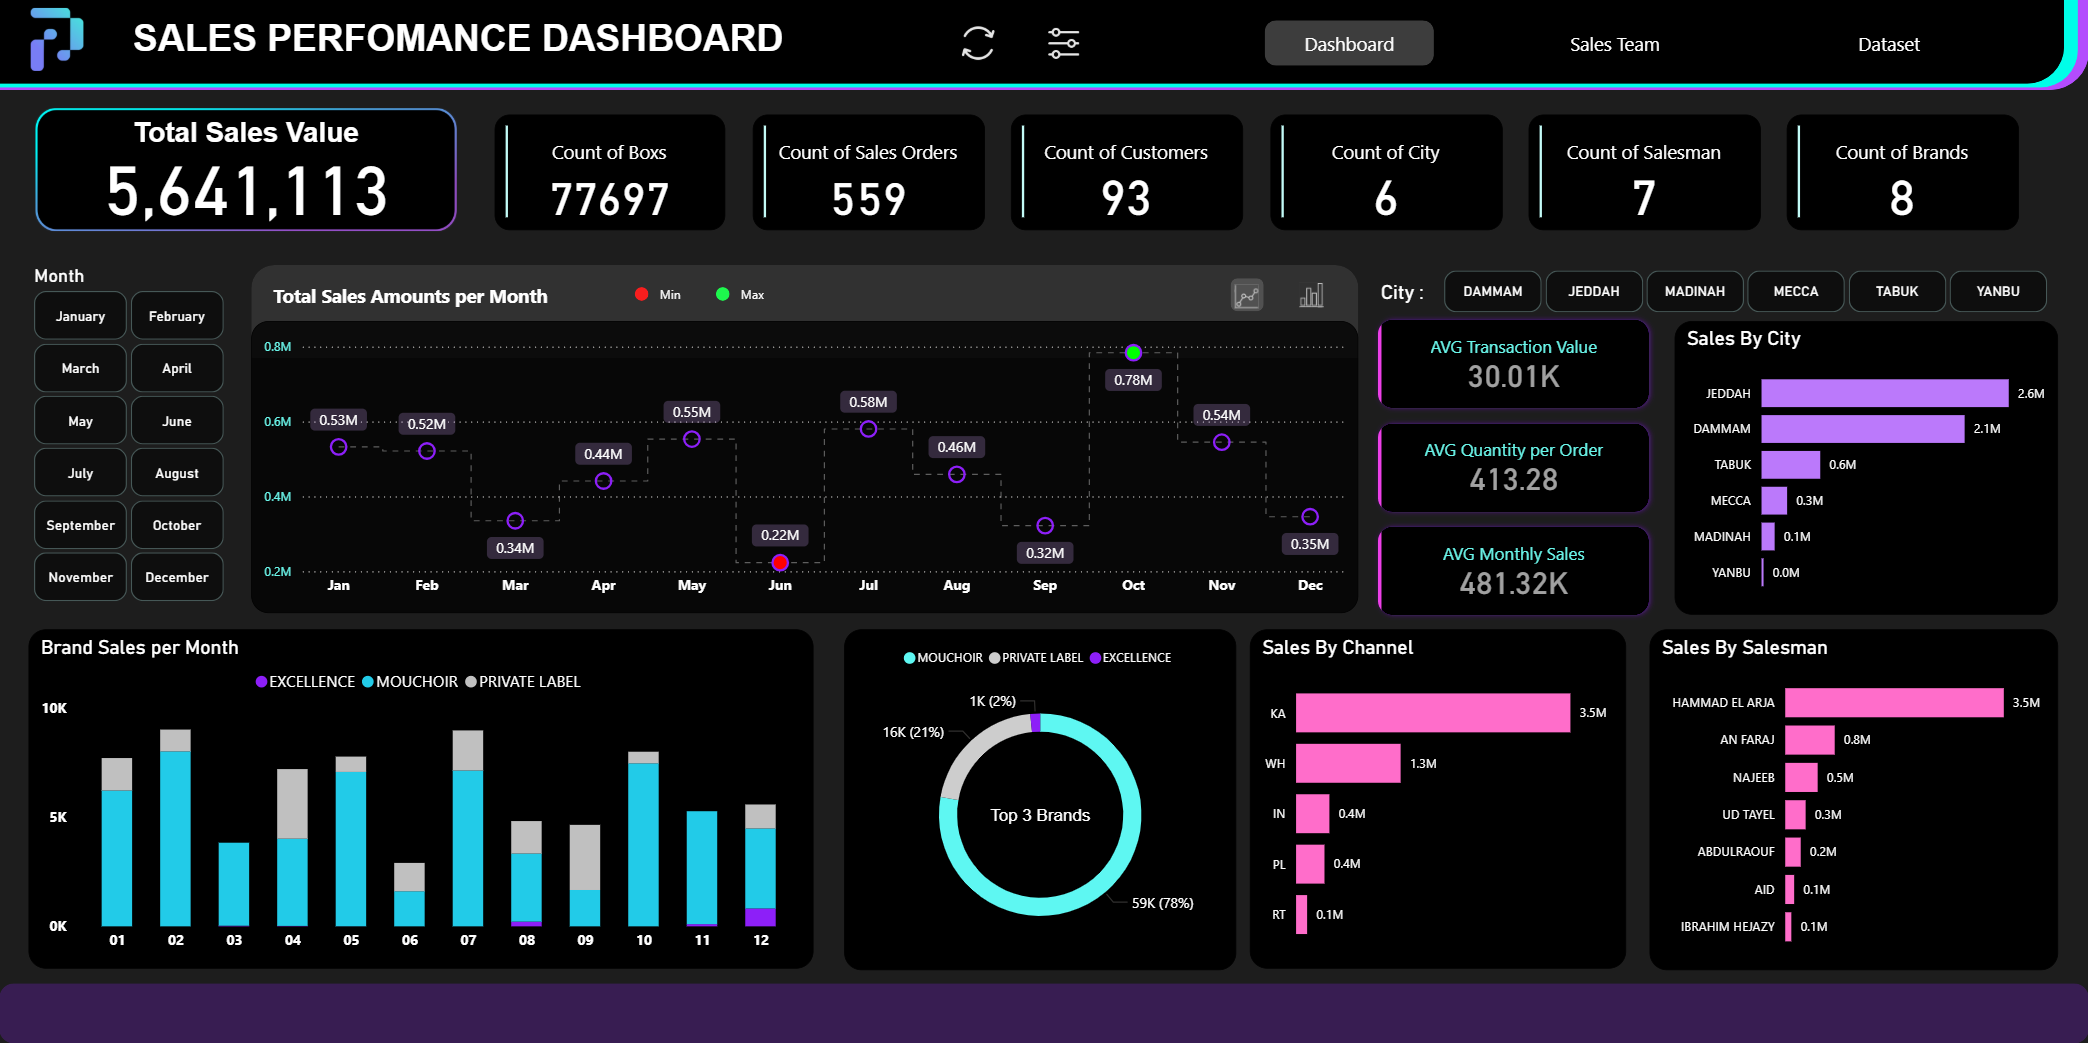
This advanced Power BI template delivers a full financial performance view for banking institutions, combining revenue, expenses, profitability, and regional contributions. It empowers finance teams and executives to monitor plan vs. actual progress, evaluate sales representative and city-level performance, assess category-based costs, and make data-driven decisions with clear monthly trends and KPIs.
Page 1 — Overview
Page 2 — Revenue
Page 3 — Expenses
🔽 Your Purchase Includes:
The full Power BI source file — Make sure you are using the latest version of Power BI Desktop for optimal performance.
The original data sources — Provided in Excel or CSV format, ready for direct connection, reuse, or customization.
Have questions about Prime Levels and our services?
Find answers to common queries below
Far far away, behind the word mountains, far from the countries Vokalia and Consonantia, there live the blind texts. Separated they live in Bookmarksgrove right at the coast
Far far away, behind the word mountains, far from the countries Vokalia and Consonantia, there live the blind texts. Separated they live in Bookmarksgrove right at the coast
Far far away, behind the word mountains, far from the countries Vokalia and Consonantia, there live the blind texts. Separated they live in Bookmarksgrove right at the coast
Far far away, behind the word mountains, far from the countries Vokalia and Consonantia, there live the blind texts. Separated they live in Bookmarksgrove right at the coast
Far far away, behind the word mountains, far from the countries Vokalia and Consonantia, there live the blind texts. Separated they live in Bookmarksgrove right at the coast
Harness the power of artificial intelligence to unlock a new realm of possibilities for your business.
© 2025 All rights reserved to Prime Levels.